REZA WAHADJ
Data Scientist &
GeoSpatial Scientific
Core
Architecture
GeoSpatial Research Consultant
GeoSpatial Strategist & Policy Maker
GeoSpatial Action
Plan Evaluator
Data Scientist Evangelism
AI & IoT Architecture
IoT-based Smart
City Platform
Holistic Smart City Architecture
Project Feasibility Expert
Project Manager & Developer
28255 Via Fierro, Laguna Niguel
California, USA 92677
Tel: 949.302.2633
Fax:
949.822.0906
e: reza@hydroinfo.org
w: http://hydroinfo.org
REZAWAHADJ
Reza has more than 25 years of experience in the field of GeoSpatial Infrastructure & Water Resources, Water & Soil Engineering, GIS & Remote Sensing Cyberinfrastructure, GeoSpatial Service-oriented Architecture & Hydrologic Information Systems. He has pursued his career in GIS, RS in Mathematical Modeling and Simulation Department of Dam & Power Plant Research in Ministry of Energy (Mahab Ghodss) in 1994 and Department of Environment in 1995. Since 1994, Reza has been involved in many international projects and disciplines by carrying out research activities for more than 9 different professional organizations and governmental agencies as follows:GIS Manager of National Partnership for Advanced Computational Infrastructure (NPACI) at University of California, San Diego (UCSD), Supercomputer Center (SDSC), Spatial Information Systems Laboratory (SISL), Sciences Research & Development Division (SciRAD), Microsoft eScience Research Center, Environmental Systems Research Institute (ESRI), California Governmental Water District, Anadarko Petroleum Corporation (APC), International Institute for Aerospace Survey and Earth Sciences (ITC), United States Geological Survey (USGS), Municipality of Glendale, Municipality of San Francisco County, and QBE North America.
His research interests include GeoSpatial Scientific Data Modeling, GIS & RS Cyberinfrastructure, GeoSpatial Ontology Processing, OGC & Open Standard Specifications in GeoSpatial, Sensor-oriented Satellite Modeling & Simulations, Making GeoSpatial strategy in national & global scale to determine location & sensor-based datasets to improve decision-making, Reducing risks and optimize operations, Enterprise Geo-Database Architecture, GDAL Integration, IoT gateway in GeoSpatial framework, Advanced Image Processing & Geoprocessing, Enterprise Geo-Database Clustering Techniques.
Particularizing Sensor-oriented Satellite Modeling, CO2 concentrations on hydrological processes, Utilizing API Level in NASA Real-Time Langley Research Center, HYGEOS/AERIS/ICARE Data DAAC, NASA's Atmospheric Science Data Center (ASDC),NASA's Goddard Earth Sciences Data and Information Services Center (GES DISC), NASA's Global Hydrology Resource Center (GHRC), Distributed Active Archive Center (DAAC), PO.DAAC, SEDAC, NSIDC, GES DISC, GIBS API, CMR, MODIS, AIRS, OMI, OMPS, LANCE (NASA Near Real-Time Data and Imagery), Oceans Near-Real Time (NRT) Data, Direct Readout Laboratory (DRL), EOSDIS Datasets, Utilizing API Level in Sophisticated NASA GIOVANNI Platform & Modeling for Comprehensive Real-Time Ocean and Coastal Analysis, Ecological Process from GeoSpatial Pattern, Pattern Recognition, Thermal and hyperspectral imagery, Landsat Program, MODIS Datasets, GDAL HDF-EOS API for MODIS-Terra image processing, USGS process-based model for MODFLOW & TOPMODEL, Global Land Data Assimilation System (GLDAS) Model (NASA), Catastrophe Modeling Architecture & Strategies, New IoT-based Emergency Modeling & Disaster Management.
Explicitly in Data Mining Techniques, Deep Learning Algorithm with R & Python, Resource Description Framework (RDF), Service-oriented architectures, Advanced XQuery Processing, Web Ontology Language (OWL), Mozilla Internet of Things (IoT) Gateway Architectures, Holistic Smart City Architecture, GeoSpatial IoT Architecture, IoT-based Smart City Platform, Multi-criteria Ontology-based Service-oriented Architecture,Data-driven decision making, Decision Support Systems in Water Resources & Solar Energy.
AcknowledgementsI would like to express my deepest and sincere gratitude to my mentor, friend of mine Dr. Jim Gray, Microsoft Technical Fellow, Distinguished Scientist, genius man with so many great achievements & attainments at Microsoft Research Center in San Francisco Bay Area, who personally supervised, supported and encouraged me all through this works, May his soul rest in peace forever.
I would also like to express my highest sincerity and gratitude to my manager Dr. Ilya Zaslavsky, the Director of Spatial Information Systems Laboratory at the University of California, San Diego (UCSD), Supercomputer Center (SDSC), genius scientist with tremendous achievements in the history of GeoSpatial, for challenging me when I needed challenging, and supporting me when I needed supporting. Furthermore, I have been learned many attributes & attitudes from him.

 Award
Award
- Microsoft Azure Research Award: Developing real-time IoT Monitoring & BIGDATA Harvesting Storage System for Energy Demand Respond in GCC Countries Award Date: June 30, 2016 Award CRM: 0518327
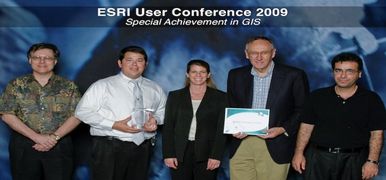
- ESRI Special Achievement in GIS (SAG) Award: Developed a unique Real-time Catastrophe Manager Analysis Tool set with Comprehensive Risk Management API Award Date: July 15, 2009
- Microsoft’s Jim Gray eScience Award: Hydrologic Data Dissemination & Analysis API for USGS NWIS, EPA STORET, NEXRAD, AmeriFlux & National Climatic Data Center (NCDC) Award Date: Oct 20, 2006
- NSF Award: Cyberinfrastructure
Summer Institute for Geoscientists
San Diego Supercomputer Center (SDSC) Award Date: July 28, 2004 Award Number: 0432080
TEACHING
Cyberinfrastructure Summer Institute
for Geoscientists
San Diego Supercomputer Center, CA USA
- GIS History and Data Capture
- GeoDatabases
- Georeferencing & Projection
- ArcSDE Data Model
- GIS Workshop
PAPERS & JOURNALS
- Forward Osmosis for Irrigation Water Supply Using Hybrid Membrane System for Draw Solution Research area: Qatar Foundation, Doha, Qatar June 2017, University of Technology, Sydney, New South Wales, Australia Publisher: CRC Press Published Date: 2018
- Qatar Dynamic Solar Atlas & Solar Resource Assessment: International Solar Energy Society, ISES Solar World Congress 2015 Qatar Environment & Energy Research Institute (QEERI)The IEA Solar Heating & Cooling Technology Collaboration Prog. (SHC TCP) Report: Proceedings 8-12, Nov 2015, Daegu, South Korea
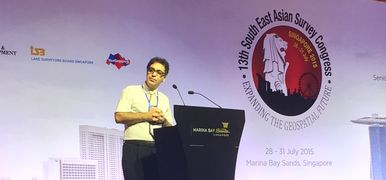
- Advanced GeoSpatial Integration in Solar Energy & Water Resources Qatar Environment & Energy Research Institute (QEERI) 28th-31st July 2015 Marina Bay Sands, Singapore
- Solar Atlas of Qatar: 3rd International Conference Energy & Meteorology Qatar Environment & Energy Research Institute (QEERI)June 22-26, 2015 Boulder, Colorado USA
- Catastrophe Modeling: ESRI International User Conference (Award) July 15, 2009 San Diego, CA USA
- Evaluation of Landscape Structure in Eram Park using GIS International Journal Environ. Res., 1(3): 258-263, 2007 ISSN: 1735-6865
- Toward a Distributed Information System for marine biology and limnology March 3, 2007 San Diego, CA USA
- CUAHSI HIS Cyberseminar October 28, 2006 Austin, Texas USA
- HDAS: A scalable system for online access to national and local repositories of hydrologic time series, Geoinformatics 2006 International Conference May 10-12, 2006 Reston, Virginia USA
- Developing a CUAHSI HIS Data Node as Part of Cyberinfrastructure for the Hydrologic Science May 10-12, 2006 Reston, Virginia USA
- ESRI Federal User Conference Jan 31, 2006 Washington, DC USA
- CUAHSI Web Services & Hydrologic Information Systems Nov. 30, 2005 Austin, Texas USA
- Microsoft Research eScience Workshop: Review HydroInfo Core Architecture Oct. 6-7, 2005 Redmond, WA USA
- Microsoft Research SciData, Scientific Data Intensive Computing May 25-26, 2004 Redmond, WA USA
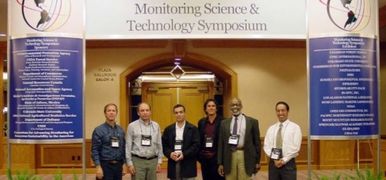
- Linking Science & Technology to Policy & Planning for Sustainable City-Region Development. The EPA's Monitoring Science and Technology Symposium United States Environmental Protection Agency (EPA)Sep. 21-24, 2004 Denver, Colorado USA
- TerraShake Simulation, Envision Journal, Discover Cyberinfrastructure University of California, San Diego (UCSD)Supercomputer Center (SDSC)Special Issue, 2004 San Diego, CA USA
PROFESSIONAL AFFILIATIONS
- Member of Microsoft eScience Research Group Since 2004 (eScience)
- Member of USGS Earth Resources Observation & Science Center (EROS)
- Member of The Environmental Systems Research Institute (ESRI)
- Member of The Open Geospatial Consortium (OGC)
- Member of US Geospatial Platform (Geospatial Platform)
- Member of Microsoft Developer Network (MSDN)
- Member of United Nation Institute for Training and Research (UNITAR)
- Member of The California Geographic Information Association (CGIA)
PROFESSIONAL COLLABORATORS
- Dr. Ilya Zaslavsky, Ph.D., Director of Spatial Information Systems Lab at The University of California, San Diego (UCSD) w:..//www.sdsc.edu/ilya-zaslavsky w:..//earthcube.org/geo.web.services
- Dr. David R. Maidment, Ph.D., Director of the Center for Research in Water Resources at The University of Texas w:..//ce.utexas.edu/prof/maidment/CAEEw:..//ce.utexas.edu/prof/maidment/gishydrow:..//ce.utexas.edu/prof/maidment
- Dr. Susan Hubbard, Ph.D., Lawrence Berkeley National Lab (UC Berkeley) w:..//eesa.lbl.gov/susan-hubbard/
- Dr. Norman Miller, Ph.D., Lawrence Berkeley National Lab (UC Berkeley) w:..//geography.berkeley.edu/norman-miller
- Dr. Upmanu Lall, Ph.D., The Columbia University w:..//columbia.edu/~ula2
- Dr. Dennis Lettenmaier, Ph.D., The University of California, Los Angeles w:..//geog.ucla.edu/people
- Dr. Michael Piasecki, Ph.D.,The City College of New York w:..//daisy.ccny.cuny.edu/~michael
- Dr. Deb Agarwal, Ph.D., Lawrence Berkeley National Lab (UC Berkeley) w:..//dst.lbl.gov/~deba
- Dr. Chunmiao Zheng, Ph.D., The University of Alabama w:..//hydro.geo.ua.edu/zheng
- Dr. David G Tarboton, ScD, Utah Water Research Lab, Utah State University w:..//uwrl.usu.edu/facultyw:..//hydrology.usu.edu/dtarb
- Dr. N. Leroy Poff, Ph.D., Stream Ecology Lab, Colorado State University w:..//pofflab.colostate.edu/
- Dr. Larry Band, Ph.D., The University of Virginia w:..//eng.virginia.edu/larry-band
- Dr. Anton Kruger, Ph.D., The University of Iowa w:..//engineering.uiowa.edu/faculty
- Dr. Kenneth H. Reckhow, Ph.D., Duke University w:..//nicholas.duke.edu/people
- Dr. Peter Harrell, Ph.D., Duke University w:..//people.duke.edu/~pharrel
- Dr. Praveen Kumar, Ph.D., The University of Illinois w:..//cee.illinois.edu/directory
- Dr. Wendy D. Graham, Ph.D., The University of Illinois w:..//waterinstitute.research.ufl.edu/faculty
- Dr. Xu Liang, Ph.D., The University of Pittsburgh w:..//engineering.pitt.edu/people/faculty
- Dr. Venkataraman Lakshmi, Ph.D., University of Virginia w:..//engineering.virginia.edu
- Dr. Tim Lee Whiteaker, Ph.D., Texas University At Austin w:..//jsg.utexas.edu/researcher


Microsoft Azure Research Project
Founded by Microsoft Azure Research
Center on June 30, 2016 Doha, Qatar
This Project has been awarded between me and Microsoft Azure Research Center on June 2016 to develop a Real-Time IoT Monitoring & BIG DATA Harvesting Storage System for Energy Demand Response in the Middle East Region (GCC Countries).
Project Proposal Abstract & Research HypothesesGulf Cooperation Council (GCC), the political and economic alliance of six Middle Eastern Countries including Saudi Arabia, Kuwait, the United Arab Emirates, Qatar, Bahrain, and Oman, recently they have been faced oil prices which have fallen to their lowest level since 2003. The effects of falling prices are being felt by economies around the world. But oil-producing nations that rely on exports have been particularly hard hit, with many now feeling the social and, in some cases, political impact.
The goal and scope of this project are harvesting, monitoring and forecasting energy demand response data at the scope of GCC countries to help each country in energy usage, monitoring & storing historical Big Data in real-time cloud-based architecture at the scale of the region. The historical datasets & real-time monitoring will be utilized in IoT in conjunction with Microsoft Azure Cloud, which will be accessible for researchers & governmental institute from the Microsoft Azure Cloud & developing IoT applications.
Research Approaches & Technical DesignAt the beginning, we have been started regardless of any standard academic approaches which normally fall into deductive or inductive approaches for each hypothesis, we have been decided to investigate how would be crucial this project based-on practical & political understanding of Gulf Region during current energy crisis, that was strong motivation towards this investigation. We proposed several hypothesis scenarios as solution to educate, motivate and help the community of GCC to realize & understand the future of energy demand by taking appropriate action before time runs out.
With this respect, we have initiated harvesting of electricity datasets in all six countries for the time interval of 5 seconds and store them in Microsoft SQL Server on three different computers. That was around June 2015, now we have 12 million electricity datasets which could lead us for future modeling & forecasting. This is the first major step towards modeling and integrating solutions.
The code has been written in Microsoft C# in cooperation with SQL Server over the HTTP Protocol, it runs every five seconds harvesting electricity demand from Saudi Arabia Command Center at Dammam region (close to Bahrain). The data has been streamed into SQL Server at the same time RAW data is also being streamed into IoT real-time dashboard in JSON format.
Since June 2015, we have been involved in this idea by architecting & developing real-time IoT for all six members of GCC countries as Backbone Infrastructure (right now we have 120 million record sets in SQL Server).
However, since this project will address the real problem at the scale of the Gulf Region by covering all six counties simultaneously in real-time Energy Consumption Demand, we are evaluating our current resources.
We are scaling out cloud-based processing not only for our storage but also for real-time demand response for each extra country.
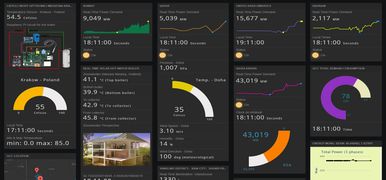
IoT ArchitectureOur architecture support SOAP/ XML as well as RESTful / JSON format to address any application that might be using such a format. Right now we are using cloud-based accounts for our real-time streaming data with limited resources from several known IoT companies such as ThinkSpeak, Xively, PubNub, etc. to close the technical loop without losing real-time datasets. This was a major step after our investigation was done.
The diagram shows the stream data flow, as well as entire architecture in detail with respect to IoT, all resources, Python Modelling, RESTful JSON, C# WebJobs, NodeJS Server, ETL SSIS, SSRS, SSAS, Raspberry PI board, SQL Server and Forecasting Algorithm.
The dashboard is real and working internally in our server back-end, it will be launched in public domain soon when we have tested & realized all parts of model works properly.
Feasibility ReviewThis project exactly suitable for Microsoft Azure Cloud or any other Cloud consist of state-of-art by actuating real-time data, analyzing them on the fly, monitoring them by suitable dashboard and storing them in cloud for future historic modeling and forecasting. We have all resources to achieve this goal. We already have been started since June 2015 in home.
This also will encourage all six GCC countries’ researchers & engineers to access synchronously to energy demand response datasets at the same time based on their local timestamps.
In the meanwhile, the ultimate goal is to encourage GCC countries to migrate their datasets to Microsoft Azure cloud by successfully executing this case study, forecasting modeling & real-time monitoring energy demand data as well as data storage services. This project can be easily customizable for any data science such as water data, metrology data, health care data and etc. in the Middle East region.
Resources:IoT Architecture:[w:..//iot.archit] IoT Developed Interface:[w:..//iot.inter] Running the Real-Time NASA GLDAS Model:[w:..//run.nasa.gldas.model] HydroInfo IoT is being pragmatized solution in the Middle East region: [w:..//hydroinfo.iot.sol]
Microsoft eScience Research Project [HydroInfo Initiation Phase]
Founded by Microsoft Research Center
on Oct. 20, 2006, San Francisco, CA USA
The Project was awarded by Microsoft eScience Research Center on Oct. 20, 2006 in San
Francisco between me and my mentor jim Gray who was genius
scientist, and manager of Microsoft Research Center in San Francisco Bay Area, USA. [to
learn more about Jim and his achievements & attainments] click here.
The primary objective of HydroInfo Project was to produce a comprehensive data warehouse/portal
that integrates hydrologic data sources. This involves data storage/management, and manipulation
when necessary to eliminate inconsistencies within a single data source as well as among
different data providers.
Inconsistencies may be encountered within data due to issues
with data quality (e.g. measurement values mixed with text), use of different units (e.g. ft/sec
vs. m/sec) or temporal resolutions (e.g. daily value vs. weekly average).
There are also semantic problems since data providers use different nomenclatures when naming parameters. Moreover, not every parameter has a counterpart in another dataset. A study conducted by Lockheed Martin Information Technology for EPA and USGS at the National Water Quality Monitoring Council points out that one EPA STORET parameter can be mapped with more than five NWIS parameters, while none of them are exact matches. The proposed system, semantic mediation will be handled not at the database level but using ontologies. The system will also exploit data mining and XML support capabilities of Microsoft SQL Server 2005. It is clear that success in data management is a must for reliable end-user services.
A good front-end is the best complement to a reliable back-end. In recognition of this fact, the envisaged system will include a portal that will help scientists to easily access different types of data, observe changes in desired areas over time and export data to their favorite hydrologic data analysis applications. Priorities will be given to MS Excel, ArcGIS, MatLab, Python and R, while customized outputs will also be supported taking into account that hydrologists also develop their own FORTRAN codes. Since analysis of large datasets may require transfer of huge amounts of data, services will be offered for server-side analysis of data, too giving more flexibility to users. Time series analysis and extreme value statistics can be named as a few examples from this toolbox.
To expose the system to developers/advanced users, web services will also be provided but within the .NET framework system when necessary for better performance.
HydroInfo Server System
A clustered search mechanism (implemented using Microsoft .NET platform) will enable users to search data across different domains using a single keyword while results are classified according to their differences such as parameter names and measurement methods. Search engine will also enable inferred results, where searching a keyword e.g. pesticide will trigger searching hundreds of chemical compounds. Inference capability coupled with clustered search approach is a powerful tool and a solution to problems with using ‘too specific’ or ‘too general’ search keywords, resulting in ‘no results’ and ‘too many irrelevant results’ respectively.
The system will also include a knowledge base of key processes and their interactions to identify resource management alternatives and to provide decision support. This gives the system a monitoring interface function as well, making individual measurement values or a group of measurements of one or many different.
Parameters meaningful to the system. For this purpose, the most critical parameters, especially those subject to management, that regulate the system and control hydrological and biotic linkages will be identified using investigators’ domain knowledge in addition to extensive statistical analysis (including but not limited to sensitivity analysis) coupled with use of appropriate hydrologic models.
Resources:Jim Gray biographical Memoir - National Academy of Sciences:[w:..//jim.gray.memoir.nas] Hydroinfo Initial Proposal to Microsoft:[w:..//hydroinfo.init.prop] Hydroinfo Microsoft Award & Sub Projects:[w:..//hydroinfo.ms.award] Microsoft eScience Research Workshop 2005:[w:..//microsoft.eScience.2005] TerraService.NET - Web Services:[w:..//terraservice.net] Technical Memorandum - NOAA-GLERL:[w:..//tech.memo.noaa.glerl] Statistical Methods in Water Resources:[w:..//stat.water] The State Of Hydrological Services in Developing Countries: [w:..//s.hydro.ser.dev.co]
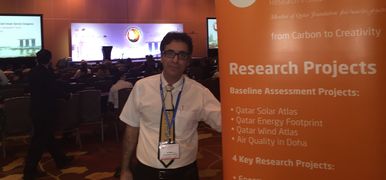
GeoSpatial Infrastructure Project
Qatar Foundation - Qatar Environment
& Energy Research Institute, Doha Qatar
Development of GeoSpatial Infrastructure for Qatar has been started in early 2015 with several objectives to architecture, design, encoding, testing and deployment of GeoSpatial Infrastructure throughout the country with the ultimate goal of integration with other GCC partners in the Middle East region.
The GeoSpatial Data Survey Report has been carried out by Richard Wood (Former QF GIS Specialist) in 2014. [download full Data Survey Report].
The GeoSpatial & Remote Sensing Road Map has been purposed & conceded by me in 2015 [download full architecture schema].
Our primary goal was introducing this infrastructure framework by fostering & promoting Qatar to GeoSpatial community in GGC & around the world. The framework robust enough to support both Qatar Foundation initiatives in Water Security and Solar Energy. The first case study has been implemented in Solar Energy with several objectives to address Qatar Solar Energy needs for upcoming years.
For the first objective, addressing energy security, QF aims to assist and expedite the
introduction of off-grid and grid-integrated photovoltaic and energy storage technologies by
providing scientific and engineering solutions to the deployment of 1GW solar power in Qatar.
This will be done through four thrust areas:
solar energy, energy storage, grid
integration and energy efficiency.
- Qatar is aiming to generate 20% of its energy from renewable sources by 2024, and have 1800 MW of installed green capacity by 2020.
- 1 billion US$ investment for producing, MTPY of poly silicon at Ras Laffan. They can cater to produce photovoltaic panels generating 6.5 GW at full capacity.
- 2022 FIFA cup in Qatar will be first carbon-neutral world cup using solar energy for air conditioning and fan zones
- During COP18, MOU signed with International Renewable Energy Agency (IRENA) for Global Renewable Energy Atlas Initiative.
- 200 MW power project under way by Kahramaa (Ministry of Power & Water).
GeoSpatial Solar Energy Development in Qatar had three phases and several stages & process. Analysis of solar irradiation components measured through ground monitoring stations combined with data derived from satellite imagery. DNI, DHI and GHI are calculated from Meteosat Second Generation (MSG) satellite HRV channel using a model based on Heliosat-II and III models every 15 minutes. By collecting real-time datasets, re-projecting from GEOS projection to GEODESY projection, getting DNI, GHI, DHI values from raster datasets, loading to SQL Server Spatial, pre-processing, post-processing, generating geometry in SQL Spatial, classification process, Generating Metadata, Generating ESRI Map Service API, Analyzing the Map Service, Pushing to Server API, Running Verification Analyzer, opening VPN channel over the server and many more steps, to learn more in detail about each process and steps, please click on Resource Section below:
Resources:Full GeoSpatial Architecture: [w:..//GeoSpatial.Arch.qa] Comprehensive GeoSpatial & Remote Sensing Roadmap:[w:..//Comprehensive.Roadmap.qa] GeoSpatial Ontology-based Schema in SOA:[w:..//Ontology.Schema.qa] GeoSpatial GIS Lab:[w:..//GIS.Lab.qa] Real-Time NASA GLDAS Model:[w:..//NASA.GLDAS.Model.qa] Meteosat Second Generation (MSG) Satellite HRV channel Geostationary Projection (C code)[w:..//MSG.Satellite.GEOS.HRV.C]
Catastrophe Modeling Project
Balboa Insurance Group - Now part of
QBE North America, Irvine, CA USA
It was a collaboration between Balboa Insurance Group & ESRI (Redlands, California). Catastrophe Modeling was the Online Real-time Risk Analysis Project with many real-time tool sets that have been developed during 5 years and enhanced every year by adding new module for monitoring specific Risk Analysis of Hurricane and other major catastrophe events in the USA.
The core engine has been prototyped & encoded in Python Script and in some area in C#.NET. CAT Manager gets its datasets at the time of hurricane from organizations such as the National Hurricane Center, National Oceanic and Atmospheric Administration (NOAA), the U.S. Geological Survey (USGS), and AccuWeather.
The datasets arriving as timely based (normally each 10 minutes) to FTP server which has been linked securely with above organizations. Python Script doing all the magic task here by pulling each polygon delineation of hurricane and creating spatial boundary in Enterprise GeoDatabase (ArcSDE for SQL Server) on the fly and internally linking spatial query request with Oracle Loan Lender Tables.
With this highly accurate data, Balboa’s clients can more precisely map where loans are at risk because there’s a high probability that the property will be damaged during a catastrophic event.
There is no predicting when or where a force of nature will strike an area. But when they do, lenders need to act immediately to assess the damages to their investments and help their borrowers begin to recover and rebuild. By giving our clients the tools of Catastrophe Manager, Balboa Insurance Group is able to offer clients a valuable solution to a critical problem; being able to assess their exposure and be as proactive as possible. By providing catastrophe information as well as assessing the possible impact to each individual loan included in the portfolio, Balboa offered a valuable solution to a crucial problem: being aware of additional risks, with as much warning as possible.
The Website also provided archived data, so clients could use previous catastrophe information as an indication of the possible effect those past catastrophes would have two current portfolios.
ESRI Press Release:Utilizing GIS for a variety of tasks including managing risk accumulation, determining effective rates for various geographic regions, and visually representing risks so the executive management team can make timely and pragmatic decisions. Since implementing its GIS in 2005, Balboa developed the Catastrophe Manager website as a tool for providing loss assessments to its Financial Institution clients.
Jack Dangermond, ESRI president's comments during CAT Modeling Award on July 2009:"Our world is being challenged by rapid change,” says Jack Dangermond, ESRI president. “GIS technology is increasingly being deployed as a way to understand the issues facing our society. At ESRI, we are always extremely impressed with the work of our users and want to recognize their efforts with our Special Achievement in GIS Award. Their work is a great example of using GIS to improve our world."
It was kind of real-time state of the art.
Resources:ESRI Special Achievement Award Winner 2009:[w:../e.esri.com/cf/sag1024] Catastrophe Modeling Project:[w:../cat.modeling.project] ESRI Award Photos 2009:[w:../esri.com/cf/sag1024] ESRI Press Release 2009:[w:../e.esri.com/press] Catastrophe Models Full Report:[w:../cat.modeling.report] Catastrophe Models & Insurance:[w:../cat.modeling] ESRI Best Practices 2012:[w:../esri.com/bp.pdf] ArcWatch ESRI e-Magazine Nov. 2009:[w:../esri.com/arcwatch] Cyber Catastrophes with RMS System:[w:../rmsCyber-catastrophes/]
GeoSpatial Investigation & Discovery Project
Anadarko Petroleum Corporation
(APC), Houston, Texas USA
The purpose of this project is to conduct an international APC GIS data inventory to develop an accurate and up-to-date overview of primary data sources in the area of GIS and Remote Sensing in order to identify and provide the necessary foundation of information required in a global APC planning effort. The goal of inventory was to assess the resulting product which will be utilized in identifying, analyzing and evaluating alternative methods for implementing such a planning process.
Given the universal need in any APC resource planning activity for baseline categories of GIS data, image processing, online mapping etc. will not only complement and assist in determining goals and objectives, but will also provide valuable information needed to allow APC planners, architects, and consultants to 'hit the ground running' in evaluating planning alternatives and implementation of GIS/RS strategies.
The inventory focused on, but was not limited to, available digital spatial data. Both attribute datasets and geographic information system layers were inventoried. Emphasis was placed on cataloging current APC GIS data resources. Completion of the inventory involved four major tasks:
- Scoping inventory content
- Identifying primary data sources
- Determining data status
- Summarizing and assessing inventory results
The first task involved developing the scope of the data inventory in terms of data themes or categories to be addressed (e.g., geology data, climate, land lease data, wells data, etc.). The second task involves identification of all primary sources for each data category. The third task was to characterize the content, level of detail, completeness, and correctness of each source. Finally, the inventory assessed the available data source options and their advantages/limitations within each thematic category.
Resources:Full investigation report available for download at: [w:..//anadarko.geogpatial.oil] Anadarko Operation Report 2016:[w:..//anadarko.operation.report.2016]
ArcGIS Server API Development Project
Anadarko Petroleum Corporation
(APC), Houston, Texas USA
Contracted as GIS Consultant requested by Anadarko Petroleum Corporation (APC) to extend ESRI prototype to ESRI Server Object Extensions (SOEs) by developing an extremely customized detail-oriented task API under SOE in .NET framework. The Server API prototype outlined several times to ensure all requirements are met at the time of implementation and encoding.
APC has several offshore undersea oil wells in the Gulf of Mexico, most of them in deep water such as the Heidelberg field, which is located in the Gulf of Mexico, about 225 km offshore of Louisiana, USA at a water depth of 1,620 m (5,310ft).
Anadarko is the operator of Heidelberg field with 31.5% interest on it. Other partners for the field development include Marubeni Oil and Gas (12.75%), Eni (12.5%), Apache Deepwater (12.5%), StatoilHydro (12%), ExxonMobil (9.3%) and Cobalt (9.3%).
The purpose of this project was to develop ESRI SOE API to address each shared oil wells operator in the contract of operation with extremely detailed well information report and task involving in each of them at the time of operation. The ESRI SOE Task API later on has been plugged-in ArcGIS Server Pool to access across the domain.Enterprise Geodatabase (ArcSDE) had a critical rule here to manage all GeoSpatial data query over the ArcServer SOE API.
Resources:Anadarko ArcGIS Server Development: [w:..//anadarko.arcgis.server.soe.oil]
The Consortium of Universities for the Advancement of Hydrologic Science, Inc. (CUAHSI) is an
organization representing more than 130 Universities in the United States & international
water science-related organizations to develop infrastructure and services to support the
advancement of hydrologic science and education.
CUAHSI receives support from the National Science Foundation
(NSF) to develop infrastructure and services for the advancement of water
science in the United States. CUAHSI's core operations are supported by a five-year grant from
the Earth Sciences Division of the National Science Foundation (NSF).
The CUAHSI Hydrologic Information System (HIS) project, also supported by the National Science Foundation, has been in operation since April 2004 and will run for a period of 7 years. This project is being conducted by a group of academic hydrologists collaborating with the San Diego Supercomputer Center (SDSC) as a technology partner. The HIS project is intended to produce a prototype Hydrologic Information System to perform the most critical functions needed to advance hydrologic science in US academic institutions, and to define the scope and extent of a more complete CUAHSI Hydrologic Information System that could be created with further investment by NSF after the end of this project. CUAHSI is anticipating that NSF will hold a competition in 2005 for a major investment in Hydrologic Observatories, for which 24 candidate watershed regions have been proposed by groups representing CUAHSI member universities throughout the United States.
On December 17, 2005; Reza and SDSC GIS Lab have been joined to Environmental Research Systems
Institute (ESRI) team to collaborate on CUAHSI project and ESRI Arc Hydro
Objects.
Project Description: [Click here]
NSF Award: [w:../nsf.gov/NSFaward] [w:../Observ.data.model.odm] [w:../Geoinformatics.2006.abstracts] [w:../cuahsi.metadata.uc.berkeley.edu] [w:../Duncan_acwi.2007] [w:../cuahsi.hydrologic.DrMaidment] [w:../cuahsi.roadmap] [w:../cuahsi.nrc] [w:../cuahsi.hydrologic.DrMaidment] [w:../cuahsi.review] [w:../boise.dev.comm] [w:../arc.realtime.vis.USGS.Data] [w:../advanc.service.ori.architech] [w:../scalable.system.HYDROLOGIC] [w:../sixth.biennial.COLLOQUIUM] [w:../water.cuahsi.his] [w:../cycore.ucsd.edu] [w:../tucson.ars.ag.gov/ICRW] [w:../awra.org/Florida2010] [w:../hydroshare.org.hydroshare] [w:../hydrodesktop]
GEON initiative project was started in 2002 as a Collaborative Research Project among a dozen PI institutions, funded by the NSF Information Technology Research (ITR) program, to develop cyberinfrastructure for Earth Science data sharing and integration. However, much of the core GEON cyberinfrastructure is generic and broadly applicable beyond Earth Sciences and Geosciences and, indeed, has been leveraged by many other projects in earth sciences as well as archaeology, ecology, environmental science, and earthquake engineering.
GEON is the second largest US NSF Award for the GEOscience Network, a collaboration of information-technology and geoscience researchers to create a modern geoinformatics cyberinfrastructure for the earth sciences. GEON will provide interlinked information systems to enable the geosciences community at large to share not only data and information, but also tools and programs that will let them collaborate more effectively than ever before. The Supercomputer Center (SDSC) is the lead player, with IT research coordinated by Chaitan Baru, co-director of SDSC's Data and Knowledge Systems program. Others participants on the IT portion of GEON include the United States Geological Survey (USGS), as well as scientists at Pennsylvania State University, UCSD Jacobs School's CSE department, and San Diego State University. The total budget of this project is $11.25 million, with $5.6 million allocated to UCSD.
GEON seeks to bring leading-edge information management research to bear on creating a cyberinfrastructure for solid earth GeoSciences to interlink multidisciplinary geoscience data sets in 4D space. The need to manage the growing amount of diverse Earth science data has been recognized through a series of NSF-sponsored community meetings on Geoinformatics. The GEON collaboration between IT researchers, who represent key technology areas relevant to GEON, and Earth science researchers, who represent a broad cross-section of Earth science sub-disciplines, will provide the foundation for a national Geoinformatics program.
There is a pressing need in the Earth sciences for a national information infrastructure that enables the community to share databases and tools to enable interdisciplinary analysis of networked data sets in studying a wide range of phenomena, including the interplay between tectonics and the evolution of sedimentary basins; the role of mountain building in the evolution of climate and life; broader predictive understanding and modeling capabilities of geologic hazards, such as earthquakes and volcanoes; the 4D reconstruction of the Earth through time; and, managing the natural resources of our planet. Each of these problems requires interdisciplinary research to discover relationships among Earth science disciplines, and depends on the community's ability to construct an integrated geoscience information system. The goal of GEON is to develop the necessary IT foundations and create such a system.
Many past and ongoing projects in geosciences have produced valuable sub-disciplinary and disciplinary databases. Numerous national centers and organizations such as IRIS, UNAVCO, the National Center for Ecological Analysis and Synthesis (NCEAS), the Southern California Earthquake Center (SCEC), as well as government agencies such as the U.S. Geological Survey (USGS), are contributing research and data to the community. Building on this basis, the imperative now is to take a step beyond research resulting in disciplinary databases, towards a new paradigm for interdisciplinary information integration and tool sharing via the creation of the GEON cyberinfrastructure. The research products and services arising from GEON will be available to the entire scientific community and will transform the way in which geoscience research is conducted, opening unprecedented avenues for research and collaboration and providing the foundation for creating geoscience collaborators.
Project Description: [Click here]
The Biomedical Informatics Research Network (BIRN) is a US National Institutes of Health
(NIH) initiative that fosters distributed collaborations in biomedical science
by utilizing information technology innovations. Currently, the BIRN involves a consortium of
21 Universities and 30 research groups that participate in one or more of three
test bed projects centered around brain imaging of human neurological disorders and associated
animal models. The BIRN mission is to accelerate Discovery Science by creating and fostering a
new biomedical collaborative culture and infrastructure.
The BIRN Network, under the direction of UC San Diego Professor Mark Ellisman and funded
by the National Institutes of Health/National Center for Research Resources, is an innovative
and award-winning geographically distributed virtual community of shared resources offering
tremendous potential to advance the diagnosis and treatment of disease.
The BIRN is a national center for research resources, with a cyberinfrastructure for storing, manipulating and sharing data and resources. Current BIRN test beds focus on neuroscience and neuroimaging, specifically human MRI and fMIR, and mouse models of neurological disease.
UCSD's National Center for Microscopy and Imaging Research (NCMIR) supplies high resolution
light and electron microscopic data on mouse models of neurodegenerative disease for the Mouse
BIRN. They have developed an on-line database, the Cell Centered Database, and a Subcellular
Anatomy Ontology (SAO), which is searchable in the OBO foundry.
At the Oct. 25, 2002 officials confirmed that the BIRN Network Operations Center-NOC or "BIRN
Central"-is located at the San Diego Supercomputer Center (SDSC), also at UCSD. It will be
linked to the research centers that shared in the NCRR award: Duke University in Durham, North
Carolina; Harvard's Massachusetts General Hospital and Brigham and Women's Hospital in Boston;
Caltech in Pasadena, California; UCSD's School of Medicine; and the University of California-Los
Angeles. Participants will collaborate on sub-projects involving mouse and human brain images.
The so-called Mouse BIRN will address a neurological disorder similar to multiple sclerosis, as
well as changes in brain dopamine levels (like those found in Parkinson's disease and
schizophrenia). The initial clinical focus in the Brain Morphology BIRN project (human subjects)
will be on depression and Alzheimer's disease.
Utilizing GIS Technologies such as ArcXML in a Grid-based GIS tool for spatial integration of multiscale distributed brain data in the Smart Brian Atlas ... see the below article:
Project Description: [Click here]
Resources:More articles on BIRN Project can be found at my repository: [w:..//Brain.Atlases.GIS] [w:..//digital.atlas.brain.WPS] [w:..//multi.Glial.Arch.Health.Disease] [w:..//EXTRA.GIS.Health]
SeaMounts Project
NSF Award - Undersea Mountains,
Seamount Ecology [Moore Project]. University of California, San Diego (UCSD), Supercomputer
Center (SDSC), CA USA
SeaMounts was a funded National Science Foundation (NSF) project which was proposed on 11/01/1999 and started on 12/01/2000. The goal of this project was to: 1) Create and compile a multidisciplinary Geodatabase in GIS system on seamount datasets that will be accessible to the scientific community through a World Wide Web interface. 2) Utilizing GeoDatabase to produce large-scale maps of biodiversity and endemism on seamounts. 3) Testing hypotheses regarding the environmental conditions which will be supporting those patterns by applying the genetic algorithms of the GARP Modeling System. The work was conducted at the University of California, San Diego (UCSD), wherein the advanced computing facilities of the San Diego Supercomputer Center (SDSC) have been combined with the broad oceanographic expertise of Scripps Institute of Oceanography (SIO) together provided the ideal environment for this research.
GARP Modeling System (developed 1999, courtesy by David Stockwell, davids@sdsc.edu)
The GARP Modeling System (GMS) is an acronym for Genetic Algorithm for Rule Set Production.
GMS is a set of modules primarily designed for predicting the potential distribution of
biological entities from raster-based environmental and biological datasets.
The modules
perform a variety of analytical functions in an automated way, thus making possible rapid
unsupervised production of animal and plant distributions.
GSM modules have the ability to perform automated predictive spatial modelling of the distribution of species of plants and animals. The essence of the system is an underlying generic spatial modelling method that filters out potential sources of errors. This approach is generally applicable, however, as statistical problems arising from arbitrary spatial data analysis potentially apply to any domain. For ease of development, GMS is integrated with the facilities of existing databases, visualization tools, and internet browsers. GMS is an example of a class of application which has been very successful in providing spatial data analysis in a simple-to-use way via the internet.
We have utilized David Stockwell’s (davids@sdsc.edu) GSM modules and built a Web Service API in C# .NET framework and extended it as Object Level to access its properties & methods by remote RCP calling inside the code, this also helping any developer who has intention to utilize such a method by calling API remotely to do the same encoded process as we did, since the Service API & maintained data sources physically resides in San Diego Super Computer Center (SDSC).
Project Description: [Click here]
Resources:The full datasets from SeamountsOnline can be downloaded in zipped CSV files at the below URL:
[w:..//seamounts.sdsc.edu/SeamountsCSV.zip] [w:..//toward.distributed.info] [w:..//sci.prior.seamounts] [w:..//online.info.system.seamount.biology] [w:..//GARP.modelling.system] [w:..//CenSeam.international.program.seamounts]
Provide a resource center to support and enhance the stature, effectiveness, and visibility of the greater San Diego Conservation Community involved in land and cultural resource conservation and management by sparking:
- Collaboration among and between resource conservation communities, the academic community, public land stewards, and the public.
- Applied research to improve natural and cultural resource monitoring and land management activities.
- Sharing of analytical tools, staff support, and research results to assist resource conservancies and public land stewards in natural and cultural resources' conservation, monitoring, and land management activities.
- A public forum on the natural and cultural resource values of the San Diego region, the challenges to these values, and the actions necessary for their stewardship in perpetuity.
- Assistance in mobilizing the financial means necessary to protect, manage, and monitor the condition of San Diego’s natural and cultural resources.
We have utilized ESRI ArcIMS Services & API (ArcXML) to build mapping tool sets which was robust Spatial Data Integration in web mapping business at that time (2002-2003).
Resources:[w:..//crn.resource.network]
PDA Water Level Project
Orange County Water District (OCWD),
Irvine, CA USA
The Water Level PDA Application has been developed at the level of county government, to help geologists & county district engineers to capture and store real-time datasets which has been collecting by time period of daily, weekly and monthly. The code has been written on ASP.NET and C#.NET by integration with SQL Server.
The dataset schema structure was simply information of Water Level in borehole wells. Basically county engineers have to write each well information by hand and move them from field station to computer in county office, the major problem was it has been time consuming process by generating many error & missing datasets at the time of collection.
An important note regarding the Water Level PDA Application is that, it could easily collect the
datasets at the well station and submitting them throughout PDA’s Wi-Fi internet access to the
main county server. The program also had a nice-looking and friendly layout with impressive data
filtering & validation process.
It saved a lot of time & money for Orange County
water district.
[w:..//WaterLevel.PDA.ocwd.ca.usa]
Construction Drawing Index (CDI) Project
City of Glendale, Los Angeles
County, CA, USA
Construction Drawing Index (CDI) has been prototyped, designed, developed & managed almost 18 years ago. It has been distributed by City of Glendale, public works engineering in California.
The software solution incorporating all parcel assets with SQL Server as backend solution and mapping API section in frontend which was addressing many problems that most local government agencies at the level of city, county and state have been facing with it.
Problems such as accessing parcel card indexes when the customer or consultant engineer asking for specific area at the city or county level. Normally it will take half hour or 20 minutes for helpdesk engineer to look for among so many parcel index cards to find such a card index, and the next step will be matching its unique ID with mapping blueprint in another section. Basically time-consuming process in reasonable timeframe since customers and engineers waiting for it.
CDI was developed to address such problem with consolidated relational mapping index between parcel card indexes, unique ID indexes and blueprints. In mid-2000, .NET framework introduced by Microsoft, and we took the advantage of this new framework to develop the CDI. It was a perfect fit for the city since many engineers really has been learned to utilize it. It was simple, powerful and easy to use even for someone doesn’t have engineering expertise. CDI was extremely practical application with so many benefits which has been helping the City of Glendale to organize their mapping section with new & modern nice looking frontend. I am glad, I had a chance to do something different for City of Glendale in that time.
Resources:[w:..//city.glendale.CDI]
ASAS Project
International Institute for
Aerospace Survey and Earth Sciences (ITC), Enschede, Netherlands
ASAS Project was one of personal project around early 1997. It was a personal contracting project between me and Dr. Abbas Farshad from International Institute for Aerospace Survey and Earth Sciences (ITC), Enschede, Netherlands.
ASAS essentially was anexpert system which was utilizing the same concept as Automated Land Evaluation System (ALES) do. ALES is a computer program was developed at Cornell University between 1986-1996 under the direction of professor Armand Van Wambeke, the author was Dr. David G Rossiter. The program allows land evaluators to build their own expert systems to evaluate land according to the FAO Framework for Land Evaluation of 1976. the main problem of ALES was:
It has been written in MUMPS (MUltifrontal Massively Parallel sparse direct Solver). It was the solution of large sparse systems of linear algebraic equations on distributed memory parallel computers. However, for personal or community land evaluator who really needs to run the program in practical manner in the field, it was too much loading on memory (high latency), also was not supported by Windows OS, but it is supported by DOS. MUMPS developed in early 1966 and still has one of the best database structure in compare with NoSQL (modern databases). Actually It predates RDBMS but has all the features of NoSQL including (in its modern form) massive parallel processing, horizontal scaling, and runs on commodity hardware.
ASAS first prototyping was intended to address these two problems and taking ALES in new OS system which will be supported by windows users as well. The first version of ASAS has been written in Visual Basic with successful effort in early 1999. For the second phase of project we had intention to incorporate with mapping API such as ESRI ArcObject API & GDAL API (The Geospatial Data Abstraction Library), but I could not get the chance to achieve this goal since I moved to USA in early 2000.
Project Description: [Click here]
Resources:[w:..//fao.org/ALES]
Advanced GeoSpatial Data Assimilation & Acclimatization (ADAA)
Global Platform in
Ecosystem Information System (GPEIS)
Founded by Microsoft Research Center
To learn
more ..
http://www.hydroinfo.org
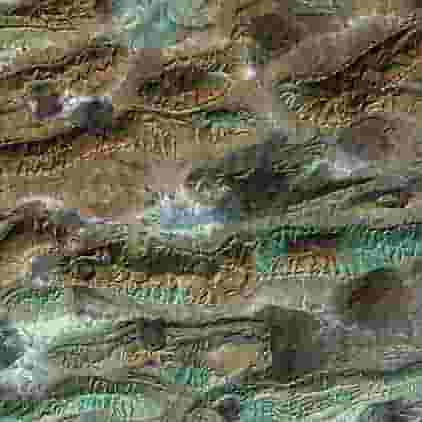
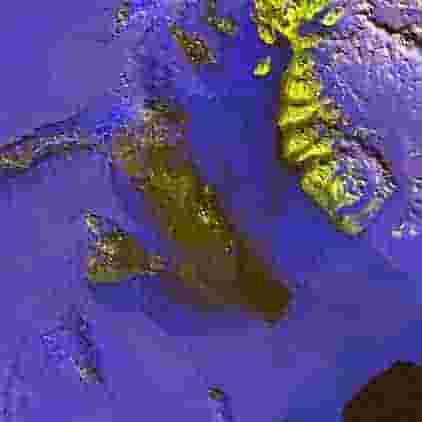
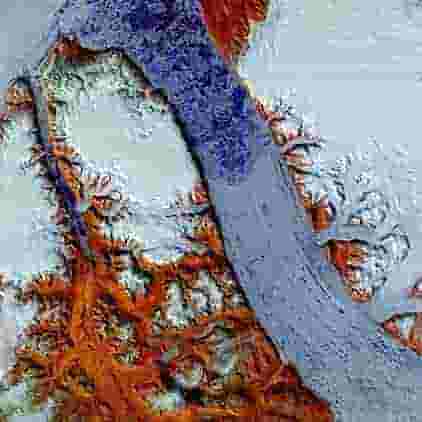
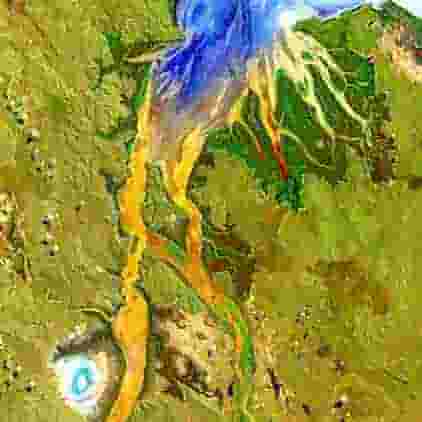
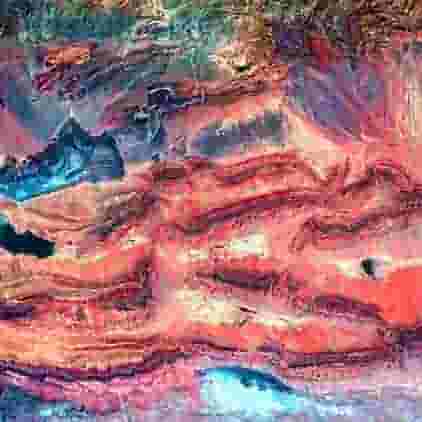
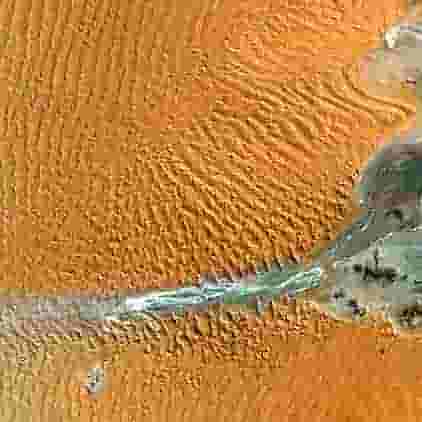
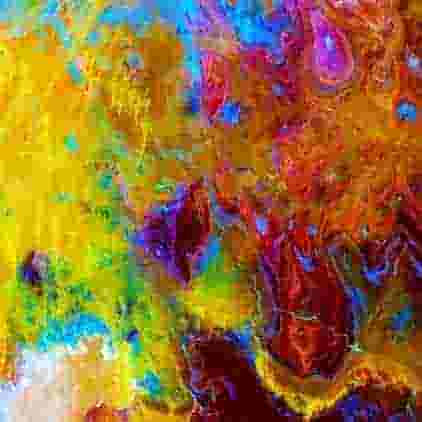
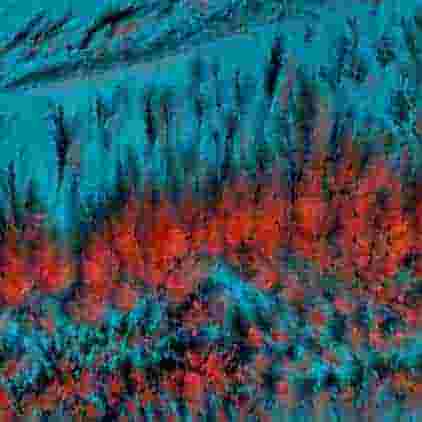
The Earth Resources Observation and Science (EROS) Center's mission is to document and analyze changes to the Earth’s land areas, across the United States Nation and around the world. To study land change, EROS researchers utilize a vast database of images of the Earth’s surface, including those acquired by Landsat satellites. EROS maintains the largest, continuous, civilian record of the Earth's land areas in the form of satellite images and other types of remotely sensed data that are fundamental to land change research. We acquire thousands of new images every day.
Millions of satellite images, aerial photos, and other types of remotely sensed data of the Earth's land areas are available from EROS--easy to search for and download with user-friendly tools. Most are available free of charge.